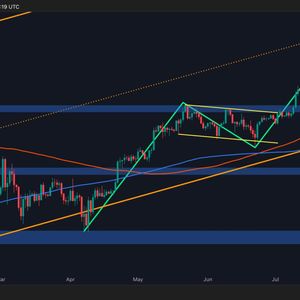
Bitcoin is currently trading around $119K after reaching a new all-time high above $123K just days ago. This historic breakout has come with aggressive momentum, flipping prior resistance levels into strong support. The overall structure remains bullish, but recent price action shows early signs of a potential short-term exhaustion. By ShayanMarkets The Daily Chart On the daily chart, BTC has respected its macro bullish channel and just broke out from a large bull flag formation that had been developing for several weeks. This continuation pattern came after a steep rally from the April lows around 75K and was followed by a clean breakout above the 108K resistance zone. Once BTC cleared that level, momentum accelerated rapidly, with the price pushing through the key 114K resistance level and tapping $123K, forming new all-time highs. The bullish structure remains intact, with higher highs and higher lows forming clearly. BTC is now sitting below the dotted trendline that marks the midline of the multi-month ascending channel. This midline zone could be the target of this price rally, as the market might reach and test it around $140K. Another critical observation on the daily chart is the confluence between the breakout and the moving averages. The asset is holding well above both the 100-day and 200-day moving averages, which are slowly curving upward. This suggests strong underlying demand and trend continuation. If BTC does retrace, the 110K zone stands out as the primary support block, not only due to recent price memory but also because it aligns with recent major highs. The 4-Hour Chart Zooming in on the 4-hour timeframe, BTC is testing the $118K–$119K bearish fair value gap, which is now acting as resistance. After the sharp rally toward $121K, the price has pulled back modestly, forming a small range just under the bearish FVG. The RSI has also cooled down from overbought levels and now sits around 58, suggesting there’s still room for more upside in the short term. However, the recent rejection from the $123K highs shows that some local resistance is forming. This could lead to short-term distribution unless bulls reclaim this bearish FVG convincingly. Yet, below the current price, several clean bullish FVGs exist, starting at $114K and extending down to $111K. These are prime zones to watch for long setups if BTC dips further. They mark strong, unmitigated demand areas where the price rallied impulsively with little resistance. A drop into these zones, followed by bullish price action (like a sweep and reclaim), would offer high-probability continuation opportunities toward 125K and beyond. Sentiment Analysis Bitcoin Retail Activity Surge One of the most telling on-chain signals right now is the surge in retail trading activity, as measured by the Bitcoin Spot Retail Activity Through Trading Frequency indicator. This metric evaluates the relative increase in retail participation based on changes from the one-year moving average. Historically, surges in this metric, especially when it turns red, have coincided with major pivots, mostly indicating overheated conditions and excessive euphoria. Right now, the chart is not showing red signals, meaning retail participation is still average. This indicates that retail traders and investors are yet to flood the market and chase the price, at least not to the extent that they have during previous all-time highs. This suggests that the price could still rise sustainably if other factors, especially the futures market metrics, remain stable. The post Bitcoin Price Analysis: BTC Bullish Momentum Returns After Recent Correction, Is $140K Next? appeared first on CryptoPotato .


